It was tough to not fall in love with David Robertson last season. For followers of Down on the Farm it was the realization of the potential we saw over the past few years. For the uninitiated it was his sneaky fastball and astronomical strikeout rate. Sure, his walk rate was at times frustrating — the game Al Aceves started in Minnesota comes immediately to mind — but his stuff made many wonder whether he could slide into a setup role and — maybe, possibly — eventually become a closer candidate.

In September we received the bad news: Robertson’s elbow was barking and he’d have to miss some time for it to heal. He did come back in time to warm up at the end of the month and make a playoff run, in which he allowed no runs on four hits and three walks in 5.1 innings. The only downside was that he struck out just three in that span, far, far below his season mark of around 13 per nine. Did something change for Robertson as a result of the injury?
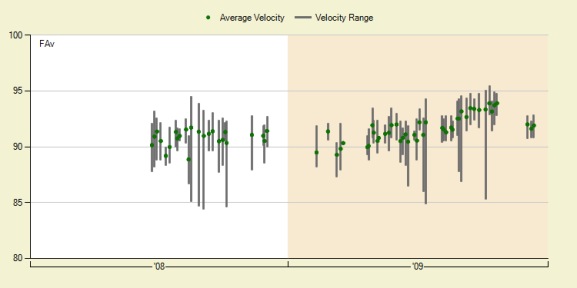
In yesterday’s post about Joba’s diminished velocity, commenter tommiesmithjohncarlos linked to Robertson’s velocity chart. He called it sexy, but after clicking the link I became a bit more concerned. You can check it out here, or view it below. In 2008, during his brief call-up, his fastball velocity sat in the low 90s. It was the same upon his call-up in 2009, but as you can see his average fastball velocity climbed after the All-Star break. As it got up to the 93.5-94 range, we see a break in the action. That’s the September injury. So how big a concern is this?
Correlation does not imply causation, so it’s difficult to say whether the increased velocity directly led to injury. The correlation certainly exists, though, so it raises some red flags. So does Robertson’s velocity upon return. Instead of averaging 93 or 94 mph, as you can see on the chart he was back down in the 92 mph range. That’s where he sat in the playoffs as well. From what I can tell, he never hit 94 after the elbow injury. This isn’t evidence that injury caused the velocity drop-off, of course. It could just as easily be that Robertson became a bit more cautious upon his return.
As Robertson’s velocity increased, he seemingly got better — not only in terms of strikeouts, but also in his walks. Again, the increase started after the first small break in the velocity plot, which represents the All-Star break. That gives us one full month of data, August. In that month he faced 45 batters, striking out 17 of them and walking just four. Just one hit a home run, and overall only three runners crossed the plate — two of which came when the team got blown out by Boston. Meanwhile, he had a ridiculously bloated BABIP, .494, though that hurts a lot less when you don’t allow that many balls in play.
Since there’s no clear conclusion on this case — I’m noting a trend rather than saying that X caused Y — I’d like to point out a few other awesome Robertson stats. In 2009 he faced 99 batters with the bases empty and 92 with runners on. In the latter category he absolutely dominated, striking out 33 to just 12 walks while allowing no home runs. He walked fewer batters with the bases empty, but also struck out fewer. He also did a damn good job of keeping the ball inside Yankee Stadium, allowing just one home run at home (84 batters faced). Finally, his poorest month earned run wise was July, in which he allowed seven runs to the 50 batters he faced. Yet his FIP that month was 3.82.
Thankfully, Robertson showed that he can get hitters out without a 93-94 mph fastball. It was a marvel to watch, and I hope he can still break it out in 2010. But if it had anything to do with his injury, at least we know he can survive without it. After all, he allowed just five runs to the 73 batters he faced from April through June, striking out 26 of them. Blazing fastball or not, I’m excited to see what Robertson can contribute this year.
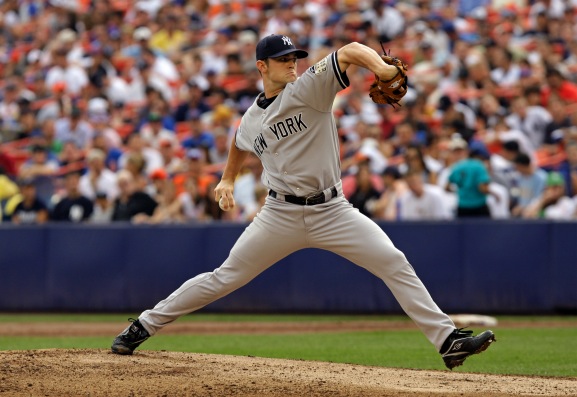
Credit: AP Photo/Kathy Willens

Leave a Reply
You must be logged in to post a comment.